11. Graphing
Graphing
Graphing
So far, you’ve coded MCL and evaluated the overall quality of your solution. Now, you’ll be able to visualize what you’ve coded, or more precisely MCL in action.
Udacity Workspace
You will be using the Udacity Workspace for this quiz. Thus, move to the next concept, enable the GPU, Go to Desktop and follow these instructions. Remeber to disable your GPU once you are done generating and visualizing the images.
Clone the Lab from GitHub:
$ cd /home/workspace/
$ git clone https://github.com/udacity/RoboND-MCL-Lab
Next, edit
main.cpp
:
Enter the code in the designated section:
//####   DON'T MODIFY ANYTHING ABOVE HERE! ENTER CODE BELOW ####

//TODO: Graph the position of the robot and the particles at each step
Then, compile the program:
$ cd RoboND-MCL-Lab/
$ rm -rf Images/*
$ g++ main.cpp -o app -std=c++11 -I/usr/include/python2.7 -lpython2.7
Finally run the program:
Before you run the program, make sure the
Images
folder is empty!
./app
If you get a warning regarding the
matplotlib
library, just ignore it.
Now, wait for the program to iterate
50
times, this should take at least a minute!
Generated Images:
After running the program,
50
images will be generated in the
Images
folder:
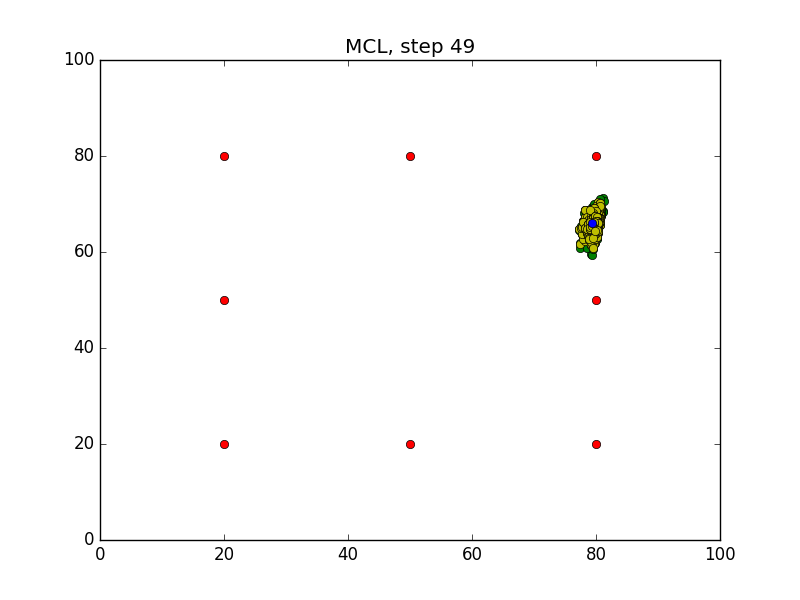
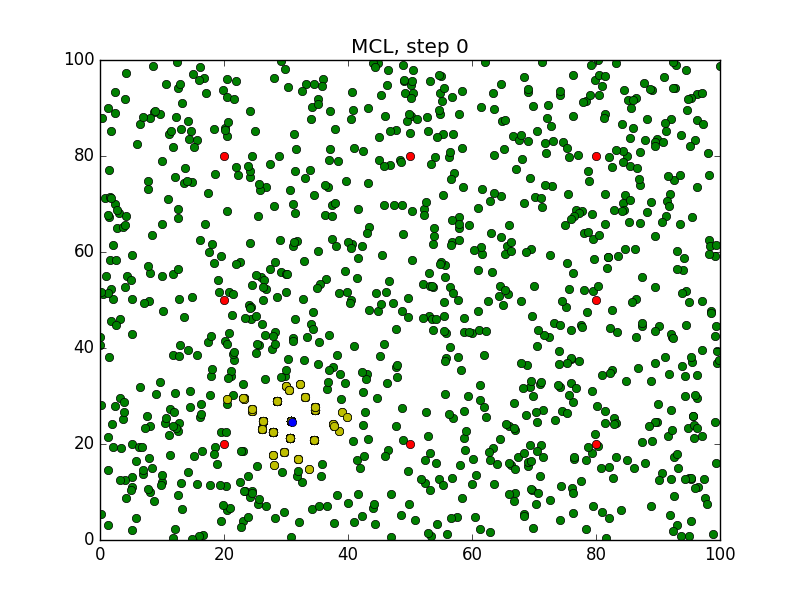
Step 0:
Step 49: